
COVID 19 testing meets Bayes’ theorem
COVID 19 has been menacing populations across the globe. It is now widely recognised that testing and crucially the efficient use of scarce testing resources plays a pivotal role in the fight against this deadly virus.
We’ve been doing some interesting pro bono work on COVID 19 testing with clinicians and academics at Manchester University NHS Foundation Trust. Some of this work has been published in a paper last week in the QJM, titled ‘Utilising Point of Care Diagnostics to Minimise Nosocomial Infection in the 2019 Novel Coronavirus (SARS-CoV-2) Pandemic’.
In this post we will describe how the paper utilises Bayes’ theorem to demonstrate a simple but important insight: the most important patients to test are the ones for whom the test result has the biggest impact on treatment decisions.
COVID 19 presents significant patient management challenges to hospital staff. Two of these challenges are testing and cohorting. Cohorting is choosing which wards to allocate patients to. If a patient who has coronavirus is admitted into a coronavirus-free ward (with reduced PPE) they could infect other patients and staff. If they are admitted into a designated coronavirus ward and don’t have it they are at risk.
The focus of this paper is on choosing which patients to test on admission. We use Bayes’ theorem to calculate the impact a test result has on our knowledge about the patient.
The prior
Clinicians assess patients by gathering data points on their history and physical condition to form a judgement on their pre-test probability of any given disease. That is, the ‘prior’ probability they have, in this case, COVID 19. Those presenting with all of the recognised symptoms, that have been in contact with a lot of other people and who were previously well will have a very high pre-test probability.
Assay sensitivity and specificity
All medical tests (‘assays’) are imperfect. Assay sensitivity is the true positive rate: the expected proportion of cases a positive result is returned if the patient has the virus. Assay specificity is the true negative rate: the expected proportion of cases a negative result is returned if the patient does not have the virus. A perfect test would have 100% sensitivity, i.e. no genuine positive cases will be missed, and 100% specificity, i.e. no-one will be incorrectly labelled as having the disease.
Armed with these conditional probabilities and priors we turn to Bayes’ theorem to give us post-test probabilities: the probability a patient has or does not have COVID 19 given they tested positive or negative.
The difference between the pre- and post-test probabilities gives us a measure for the value of the test: the impact the test has on our knowledge about the patient.
Bayes’ theorem and likelihood ratios
This is the classic definition of Bayes’ theorem:
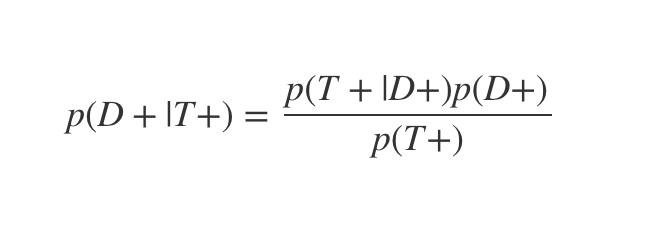
Where D+ indicates the patient has the virus and T+ that they test positive. p(D+|T+) is therefore the probability the patient has the virus, given they test positive.
Bayes’ theorem shows you how to combine prior information and data (pre-test probabilities and test sensitivities / specificities) into posterior probabilities: the post-test probability.
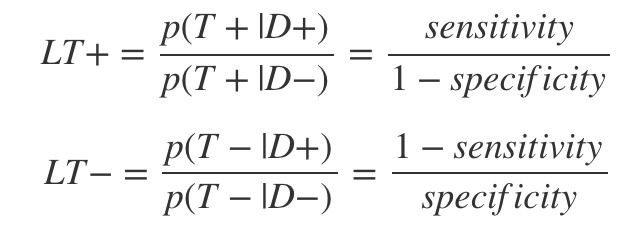
Likelihood ratios are ratios of test sensitivity and specificity estimates which make the calculation a little easier. There is one for the positive and one for the negative cases:
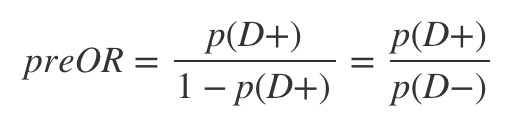
The last ingredient in the calculation is the pre-test odds, which is just:
To get the post-test odds we can simply multiply the likelihood ratio by the pre-test odds. To see why this is so, let’s first rewrite Bayes’ theorem in terms of odds:
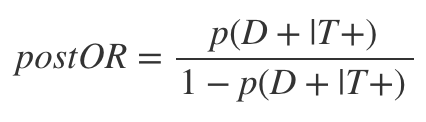
Then by a few substitutions we get:

As can be seen, this is just the product of the LR+ and the preOR. The post-test odds can then be converted back to a post-test probability by:
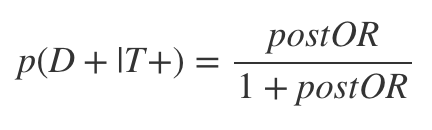
Once this logic is clear, all we have to do is code it up then plug in different pre-test probability values and sensitivity and specificity assumptions and get out the post-test probability numbers. Our final measure of interest is the difference between the pre- and post-test probability numbers.
Visualisation of the results
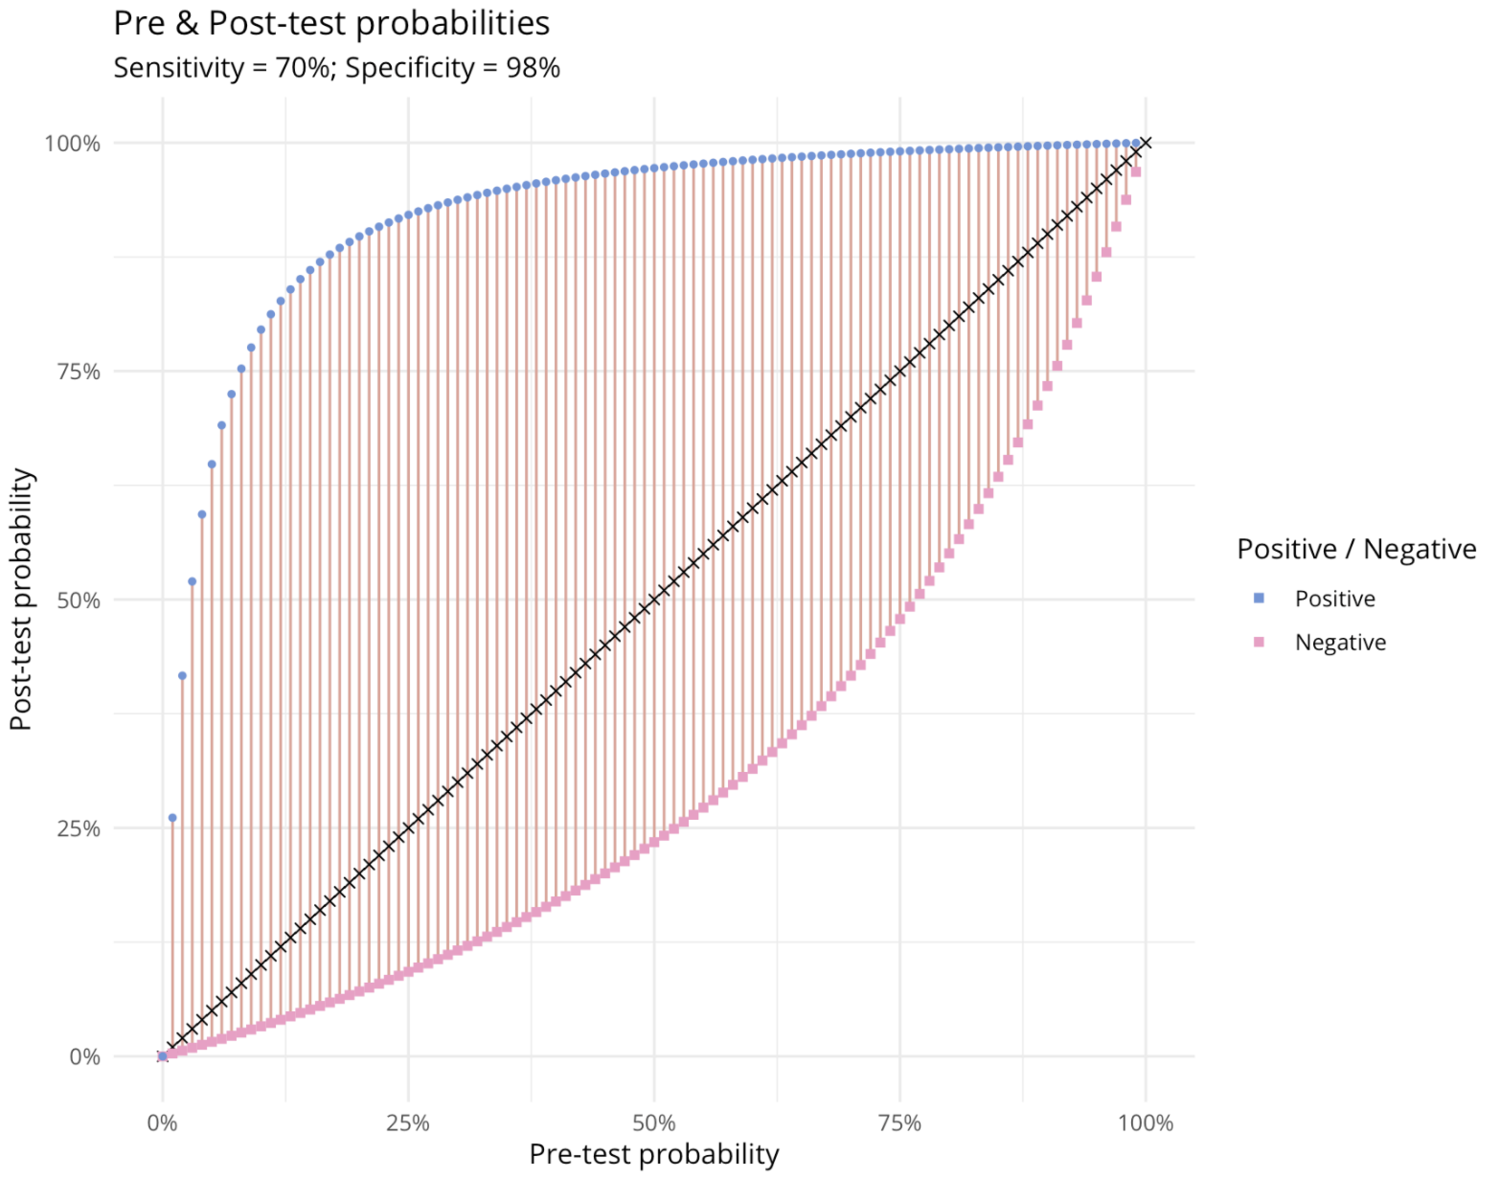
Our first plot shows how positive and negative test results for a given sensitivity and specificity transform pre-test into post-test probabilities. In the positive case (blue points) the biggest impact is at pre-test probabilities of around 14%. In the negative case (the pink squares) the biggest impact is at a pre-test probability of 64%. This suggests that the value of a point of care test is greatest for the indeterminate cases, rather than for those who seem a priori likely to have it.
The second plot shows the impact of tests with different sensitivity assumptions on post-test probability (specificity is assumed to be 98% in all cases).
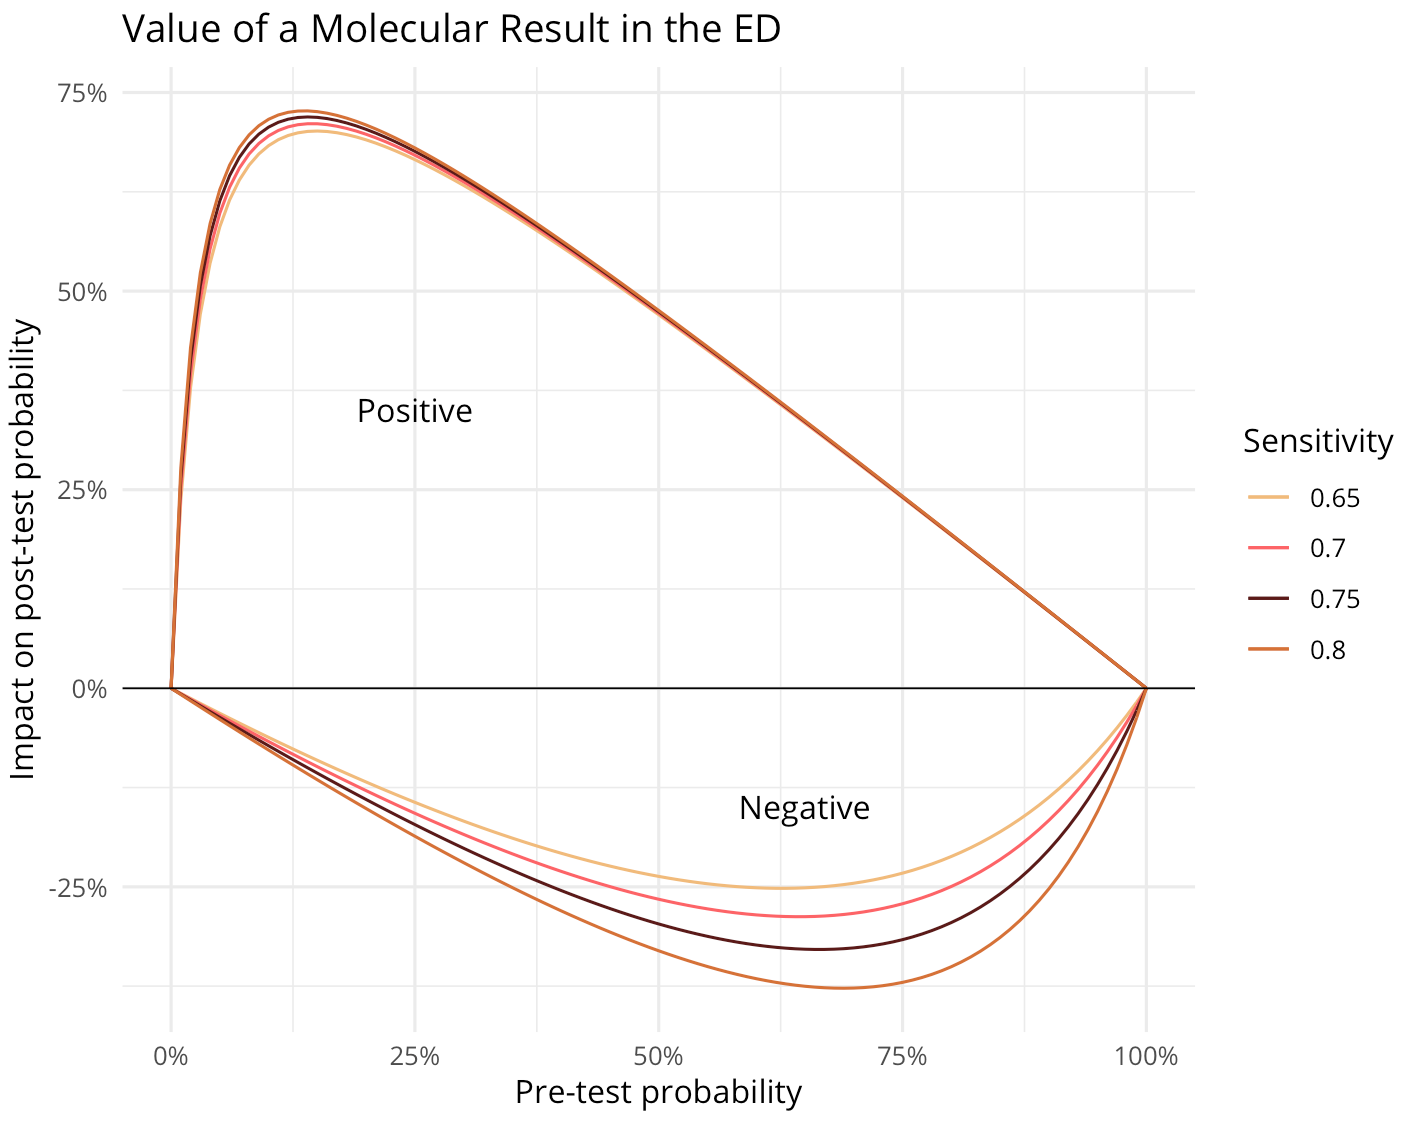
ED = Emergency Department
Again, we can see that the indeterminate cases are where the biggest value is derived in each case (widest vertical distance, positive or negative, from the x-axis).
There are many opportunities to build on this work, including for example sampling from prior and specificity / sensitivity distributions rather than point estimates. And we hope these insights can help ensure testing resources are used as efficiently as possible.
Our thanks again to Dr. John McDermott and the team for inviting us to join in this work and all the great work they’ve been doing on the frontline!